Client-driven tools: Improving evaluation for low-literate adults and teens while capturing better outcomes
Client-driven tools: Improving evaluation for low-literate adults and teens while capturing better outcomes
Margaret Johns, MPA, RD
Advisor
University of California Cooperative Extension, Kern County.
Marilyn S. Townsend, PhD, RD
Cooperative Extension Specialist
University of California, Davis.
Abstract
Cooperative Extension (CE) programs are now asked to do more than just increase client’s knowledge. Educational materials and programs are currently designed to change attitude, skill and behavior. Capturing impacts needed to demonstrate these changes are very difficult when working with low-literate audiences. Clientele for CE programs are often reading at 4th-6th grade levels with new adult immigrants reading at Grades 1 or 2 or lower. Consequently, collecting evaluation data to demonstrate impact is difficult. This paper outlines the theories and steps involved in improving the ability of evaluation tools to more accurately capture existing behavior change among low-literate participants of CE programs.
Key words: evaluation, theory, low-literate/literacy, readability
Introduction
Collecting evaluation data from low-literate clientele is difficult for both the Cooperative Extension (CE) educator and the program participant. Low-literate clientele are often embarrassed when they are not able to successfully complete the required evaluation. In the group setting, other participants often rush to assist causing disruption during the limited class time. The evaluation process is an enormous challenge when working with low-literate clientele.
Results of the National Adult Literacy Survey conducted in 1992, showed that about 22 percent of adults in the United States demonstrated the lowest level of literacy (National Center for Educational Statistics 2002). Another 25 percent of respondents scored in the next level of literacy described as “limited.” These percentages represent about 90 million of the 191 million adults in the United States.
Some clientele for Cooperative Extension programs are reading at 4th – 6th grade levels. New adult immigrants may be reading at Grades 1 or 2 or lower and many are participants of two large CE programs, i.e., the Expanded Food and Nutrition Education Program (EFNEP) (U.S. Department of Agriculture, EFNEP) and the Supplemental Nutrition Assistance Program–Education (SNAP—Ed) ( US Department of Agriculture, FNS). Reporting food behavior poses a difficult cognitive task. It can be profoundly influenced by question wording, format, context (Schwarz and Oyserman 2001), and visuals. Evaluation tools which limit total words and words of three or more syllables and use clear visuals featuring shape and color realism in place of text are more effective in collecting accurate data with low-literate clients (Levie and Lentz 1982; Townsend, Sylva, Martin, Metz and Wooten-Swanson 2008).
Cognitive complexity required to answer one question.
Popular evaluation questions are often used by CE nutrition professionals following a series of nutrition lessons. These questions involve more complexity for the low-literate client than one might suspect. An example is used here to demonstrate this complexity. “How often do you serve at least 1 ½ to 2 cups of fruit to your family each day?” with 6 response options “Does not apply”, “Never”, Seldom”, “Sometimes”, “Most of the time”, “Almost always”, and “Always”. When asking this question, CE professionals implicitly expect the client to understand the question by
(1) recalling their families’ fruit behavior each day,
(2) retrieving relevant fruit serving information from memory for meals,
(3) retrieving the same information from memory for snacks,
(4) converting fruit serving information into the number of cups served each day,
(5) comparing this number to the 1 ½ to 2 cups of fruit mentioned in the question,
(6) comparing the number of cups with the response options, and last,
(7) mapping this fruit quantity into the response option choices on the tool.
Implicit in these expectations is the assumption that clients can recall their fruit serving habits during a specific reference/time period and can report on their behaviors with candor and accuracy (Schwarz and Oyserman 2001). Given the seven cognitive steps involved in responding to this example of one behavioral item, it is easy to see why low-literate clients need as much assistance as possible with the design of the evaluation tools. Further complicating the evaluation process is choice of response options. The client does not always understand the text. For example, what is the difference between “seldom” and “sometimes?” For some clients, these words are abstract causing some confusion and hindering the validity of the evaluation process.
Limited examples available.
A 1982 review of 46 learning studies using text information with and without visuals revealed an overwhelming advantage for the inclusion of visuals as a mechanism for enhanced understanding and learning. In no case was the text-alone version reported to be better for the client (Levie and Lentz 1982). At the same time, a major 2002 nutrition education literature review found no illustrated-text tools for program evaluation despite the research base provided by these 46 studies (Contento, Randell and Basch 2002).
In our current search of the literature, we found few reports of such evaluation tools for participants of USDA food assistance and education programs or other Cooperative Extension programs (Townsend, Sylva, Martin, Metz and Wooten-Swanson 2008; Sylva, Townsend, Martin and Metz 2006). Attention to literacy is most critical for low-income programs when the person responsible for reading the evaluation tool is the participant, not the educator, and program delivery is conducted in a group setting instead of one-on-one.
Goal for this paper. Our goal is to explain the theoretical basis and a process for improving the ability of evaluation tools to more accurately capture existing dietary behavior change among low-literate participants of CE programs. We outline our recommended steps involved in developing a tool for this audience. This report builds on a previously published report for development and validation of evaluation tools for the Supplemental Nutrition Assistance Program-Education (SNAP-Ed) (Townsend 2006). As noted, these evaluation tools for low-income clients should be easy to administer, have a low respondent burden and be easily understood by clients (Townsend, Sylva, Martin, Metz and Wooten-Swanson 2005). Employing visual information processing theories (Table 1) and methods in recently published work (Sylva, Townsend, Martin and Metz 2007; Banna,Townsend and Sylva 2010), we suggest that a representative color illustrated-text style for an evaluation tool would be the preferred choice of CE participants, would facilitate understanding and would result in increased readability compared to the traditional black/white text-alone style.
Developing client-driven tools for low-literate CE audiences.
Learners are better able to make connections between words and mental images during the learning process, if words and corresponding pictures are physically presented (Mayer 1999). With words alone, CE clients try to form their own mental images and connect those with words, but this process is more difficult for low-literate learners. Visuals facilitate this process.
Motivational appeal of instructional materials for all audiences is important, but especially for low-literate clients. Getting and sustaining the attention of clients is an element of motivation and a prerequisite for understanding evaluation questions (Keller 1987). Holding the attention of clients while increasing fidelity to the evaluation process has the unintended positive consequence of eliminating a portion of the random error associated with the tool.
Researchers studying visual information processing have summarized their work as theories that can then be applied to nutrition and health education. These theories, serving as the research base, inform the development of readable tools for low-literate audiences.
Step 1. Using these theories in the development of the assessment tools for low-literate audiences. The first theory for discussion is Sudman’s Principle. Sudman’s general principle of formatting is that the client’s needs must always come first, particularly when the evaluation tool is self-administered (Sudman 1982). The client is under the stresses of the education process and those stresses increase when literacy is an issue. The appearance of a self-administered tool has an important impact on the responses, particularly for low-literate clients. These low-literate clients viewing the evaluation tool should think that they are capable of reading and understanding it, and have the impression it is professionally designed for adults. The CE program educator’s needs should come second. Making the tool easy to administer is important. The needs of the data entry process and staff are less important and come third. Often, the ease of data entry takes precedent in many testing situations; Sudman challenges this approach. And last, should come the needs of the program administrator, who sits on the sidelines during the evaluation process. Refer to Table 1.
Some research has focused on color realism in instruction by examining visual complexity and information processing. Realism Theory contends that the addition of meaningful visual cues to the text items on an evaluation tool increases the ability of the client to store and retrieve information (Berry 1991). At the same time the Cue Summation Theory holds that learning increases as the total number of cues increases (Severin 1967). The inclusion or absence of color information is regarded as one dimension of visual complexity. Color can function in two capacities. First, it can serve a coding function. Second, it can be used to present a more realistic version of the illustration. In addition to providing a greater number of cues, color provides the client with more realistic attributes with which to store information (Berry 1974). Refer to Table 1.
When comparing realistic and non-realistic color versions of the same instructional materials, the realistic color versions were more effective in the learning process (Berry 1974). Later Berry found that realistic and non realistic color materials were superior to monochrome versions for pictorial recognition, comprehension and memory (Berry 1991). Refer to Table 1.
Dwyer’s research generated the Visual Realism Continuum theory where realism cues provide the learner with more information than abstract representations (Dwyer 1972). Realism is provided as shape and color. Shape and color realism in a photograph provides the greatest learning compared to a greyscale photograph, a black/white realistic line drawing or an abstract visual. Refer to Table 1.
Table 1. Theories of visual information processing applicable to the development of evaluation tools for better capturing program impacts with low-literate CE participants.
| Theory name | Theory description | Application to low-literate teen or adult CE audiences |
| Sudman’s Principle a | Priority should be given first to the learner’s needs, not those of the teacher, facilitator or administrator in the education process. The latter professionals are not subject to the stresses of the education process. | With application to development of CE evaluation tools, the client’s needs should receive top priority; the EFNEP educator administering the tool next highest priority; and the data processing staff a lower priority. The needs of the program director should come last.
Although targeting low-literate clients, the format of the evaluation tool should give the impression of a professionally designed and printed instrument appealing to teens or adults, depending on the audience. A childlike appearance should be avoided. |
| Realism theory b | Realistic visuals in the learning process facilitate understanding better than abstract versions. | Comparing realistic and non-realistic versions of instructional materials, realistic materials are more effective in the learning process and, consequently, the preferred choice for SNAP-Ed and EFNEP audiences. For example, a photograph of an apple is more realistic than a line drawing of the same apple. A red apple is more realistic, i.e. easier to identify as an apple, than black/white version. |
| Cue Summation theory c | Color provides more realism to aid the learner’s understanding by functioning in a dual role: coding and realism. For the coding function, additional information is provided by the color. Alternately, color can be used to present a realistic version of the visual’s content. | The addition of visual cues increases the ability of the low-literate CE client to store and retrieve visual information. Color in visuals acts as an additional cue to aid the learner’s understanding, e.g. the white color for a beverage conveys the type as milk without the client having to read the word milk or dairy.
Color provides the low-literate learner with more realistic attributes or “handles” with which to store, understand and retrieve information. For example, a color photograph of cups of fruit compared to a text only question asking about cups of fruit provides realism to the quantity of fruit and realism to the quality by the real color of each item. |
| Realism Continuum d | Dwyer proposed a visual realism continuum: color photographs provide a more realistic impression of objects than monochrome photographs; monochrome photographs provide a more realistic impression than monochrome line drawing representations. | Abstract black/white line drawings are less effective than realistic black/white line drawings for CE evaluation tools when the realism of color is not an option. Black/white photographs are more effective than drawings. Color photographs are more effective for encouraging learning or understanding than monochrome photographs. The more realistic the color photographs, the more effective for low-literate CE audiences. A photograph of a red apple is more effective with this audience than a black/white photograph, a colorful abstract picture or a line drawing of the same apple. |
a Sudman, S., N.M. Bradburn. 1982. Asking Questions. Jossey-Bass Publishers, San Francisco.
b Berry, L.H. 1991. The interaction of color realism and pictorial recall memory. Proceedings of Selected Research Presentations at the Annual Convention of the Association for Educational Communications and Technology.
Berry, L.H. 1974. An exploratory study of the relative effectiveness of realistic and non-realistic color in visual instructional materials (Doctoral dissertation, the Pennsylvania State University). Dissertation Abstracts International;35, 7717a.
c Severin, W. 1967. Another look at cue summation. AV Communication Review. 15;233-245.
d Dwyer, F.M. 1972. A Guide for Improving Visualized Instruction. The Pennsylvania State University, State College, PA. Learning Services.
Step 2: Using existing tools in the health education, youth development and CE literature, as a place to begin drafting text. Beginning with a tool containing the appropriate health/nutrition content, but targeting a literate audience, is easier and thus preferred. If no appropriate tools are easily located, then it is time to begin with a thorough review of the relevant literature. This will save time in the long run. Building on another researcher’s tool is preferred; ignoring the literature is not. So assuming a tool is available for the appropriate content, consider the text as version 1 and move to Step 3. Revision of the text by clients will occur in Step 4.
Step 3. Preparing visuals. To save time and thus money, we searched the internet for appropriate visuals and found none with the required permissions. We looked at online photo galleries because the purchase of the right to use a photograph for one time use is less expensive (about $35 to $75 in 2008) than the alternative, staging and photographing a visual. We found beautiful photographs, all of middle and upper class people, schools, kitchens and backyard gardens. Consequently, we ended up taking our own photos using the University laboratory. This approach worked for food photos showing our hands. No kitchen counter tops and pantry were visible. But this approach did not work for other photographs. Finally, we used the only approach that worked for us: recruiting low-income families with parents and their children serving as subjects and giving us permission to film in their kitchens for food visuals, living area for family eating visuals, the child’s bedroom for television visuals, and the back yard play areas for physical activity visuals. Parents signed photographic release forms granting the University use of the visuals for educational purposes.
Step 4: Testing text and visuals with members of the audience. Cognitive interviewing techniques have been used in the last 10 years to improve the quality of nutrition education materials, including assessment tools (Alaimo, Olson and Frongillo 1999). The first strategy we used is the ‘think aloud’ approach where participants respond to a questionnaire item and then are asked to describe the meaning of the item using their own words. They are asked to identify how they decided upon the selected response option (Willis 1994; Willis 1991). The second is the use of probing techniques to encourage the respondent to elucidate further her meanings. And the third is the ‘paraphrasing’ technique where she is asked to restate the item but using her own words. And last, to avoid potential client embarrassment, we asked clients to think about other parents at the Head Start site, other clients at the food bank/soup kitchen, etc. How could we make the text and visuals better for these other parents, clients, etc? Would any of the words be difficult for them? We found these strategies useful. Sample protocols are available from the second author.
Using the recommendations of Keller and Sudman, we sought client preferences about the overall tool. We asked about response options, header, instructions and general appeal. We asked them to sequence the individual items by difficulty and sensitivity. The more difficult items, e.g. reading nutrition labels, those more likely subject to social desirability bias, e.g. frequency of child eating fast food, and those sensitive or threatening e.g. frequency of food insecurity, were placed near the end of the tool. (Keller 1987).
Step 5: Continuing interviews. How many to conduct? The interview process is iterative. In other words, we interviewed and then revised the wording of questions, response options and header, and visuals until both clients and CE staff were satisfied with the final product. This is considered the saturation point. This version is now referred to as a client-driven tool. For this final version, decisions about how to ask questions, i.e. the wording, and the content of visuals were made by the clients. Decisions about the selection of nutrition content for the tool were made by academics. This has been described as the Evaluator’s Division of Responsibility (Townsend 2007). Two examples of items from the University of California Cooperative Extension Fruit and Vegetable Checklist (Sylva, Townsend, Martin, Metz 2007) are shown in Figure 1.
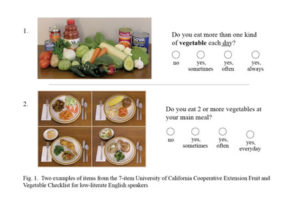
Figure. 1. Two examples of items from the7-itemUniversity of California Cooperative Extension Fruit and Vegetable Checklist for low-literate English speakers
Step 6: Assessing readability. Assessing readability of the final version of the tool is important and will give you confirmation of success. Readability is defined as the ease of understanding of the evaluation tool (Nitzke and Voichick 1992). Two popular readability formulas for English text consider vocabulary, word complexity, sentence length, and writing style: Flesch-Kincaid Reading and Flesch Reading Ease (Klare 1984). There is no existing method for assessing readability of text with visuals (Townsend, Sylva, Martin, Metz and Wooten-Swanson 2008). A corresponding formula for Spanish text is the Fernández-Huerta score (Fernández-Huerta 1959). The easiest approach for assessing readability for the English text component of the color illustrated tool is by using Microsoft Word software (MS Office for PC, Microsoft, Inc., Seattle, 2003). Formula scores are generated for each item and for the entire tool including the header and instructions.
For the two examples of items from the final version of one of our food behavior evaluation tools with the color illustrated-text style (Figure 1) (Sylva, Townsend, Martin, Metz 2007), we generated a Flesh-Kincaid Readability score of grade 3.7 and a Flesch Reading Ease score of 88. The scores reflect text only— recognizing that the visuals, layout and overall appeal are not factored directly into the score. If this were possible, one might expect a more favorable readability score.
Are we getting better results when using these tools?
We recently completed a study of psychometric properties, i.e. face validity (Banna, Vera-Becerra, Kaiser and Townsend 2010) and factorial and convergent validity and reliability (Banna and Townsend, In press), of a food behavior checklist tool for Spanish speakers (Banna, Townsend and Sylva 2010). Because assessment studies of psychometric properties are lengthy and expensive, we hope to undertake a study in the future comparing the visually enhanced tool with its corresponding black white text version for measurement accuracy. In the interim, English-speaking clients (n=18) reported in group interviews (n=4) that the new visually-enhanced tools captured their attention, stimulated interest in the evaluation process where there was none previously, improved their understanding of the behaviors in question (i.e. cognitive function), enhanced readability by reducing the word count (i.e. compensatory function) and provided cues to understanding the text (ie. cognitive function) (Townsend, Sylva, Martin, Metz and Wooten-Swanson 2008). The cognitive and compensatory functions of these tools with their visuals were particularly important for clients whose primary language is not English. When asked about the visuals, clients commented on the realism, and cognitive and compensatory functions:
“This looks so realistic….just like my house.”
“The photo helps me understand the vegetable question.”
“This picture looks like my family.”
“I know this question is about reading labels in the supermarket…the photograph of the Hispanic lady is reading the cereal label in the breakfast aisle at the market.”
Concluding Summary
In order to more accurately measure the impact of CE educational programs on low-literate clientele, we suggest that a representative color illustrated-text style for an evaluation tool would be the preferred choice of CE participants. These tools would be more user-friendly and thus would facilitate understanding and would result in increased readability compared to the traditional black/white text-alone style. Such tools would also assist in developing trust with the clientele we are serving. Educators would have less frustration collecting data. It is best for educators and clients to begin an educational intervention on a positive note rather than one wrought with frustration.
Theory-driven assessment tools that are evaluated for reliability and validity would enable CE professionals conducting programs to have more confidence in the data collected. This, in turn, would assist these professionals in collecting valuable feedback which could then be used to inform education interventions, such as those sponsored by CE.
In this era of diminishing resources, accountability is of utmost importance for Cooperative Extension programs. It is no longer acceptable to just show knowledge gains; demonstrating impacts in the form of attitude, skill and behavior changes is crucial. This process is an enormous challenge when working with low-literate clientele. The results of using more visuals and less text in client-driven tools go a long way in developing trust with those we serve. The process described here equated to a more positive educational intervention experience and enhanced our ability to better communicate the impacts of our programs.
References
Alaimo K., C. Olson and E. Frongillo, 1999. Importance of cognitive testing for survey items: An example from food security questionnaires. Journal of Nutrition Education 31:269-275.
Banna J., M.S. Townsend and K. Sylva, 2010. University of California Cooperative ExtensionLista de habitos alimenticios (Food behavior checklist). University of California, Davis. (Spanish, 22-items reflecting both MyPyramid & Food Guide Pyramid Guidance Systems and results of face, factorial & convergent validation study; Visually enhanced food behavior checklist in 6-page booklet designed for clients with limited literacy skills. Available at http://townsendlab.ucdavis.edu. Accessed July 5, 2010.
Banna J., L.E. Vera-Becerra, L.L. Kaiser and M.S. Townsend. 2010. Using qualitative methods to improve questionnaires for Spanish speakers: Assessing face validity of a food behavior checklist. J Am Dietetics Assoc. 110:80-90.
Banna J. and M.S. Townsend. Assessing factorial and convergent validity and reliability of a food behavior checklist for Spanish-speaking participants in USDA nutrition education programs. Public Health Nutrition. In press.
Berry, L.H. “The interaction of color realism and pictorial recall memory” Proceedings of Selected Research Presentations at the Annual Convention of the Association for Educational Communications and Technology, 1991.
Berry L.H. “An exploratory study of the relative effectiveness of realistic and non-realistic color in visual instructional materials” (PhD diss., Pennsylvania State University, 1974). Dissertation Abstracts International;35, 7717a.
Contento I.R., J.S. Randell and C.E. Basch. 2002. Review and analysis of evaluation measures used in nutrition education intervention research. J Nutr Educ Behav. 34:2-25.
Dwyer F.M. A Guide for Improving Visualized Instruction. The Pennsylvania State University, State College, PA. Learning Services, 1972.
Fernández-Huerta J. 1959. Medidas sencillas de lecturabilidad. Consigna 214:29-32.
Keller, J.M. Development and use of the ARCS model of instructional design. Journal of Instructional Development, 1987, 10 (3), 2-10
G.R. Klare, Handbook of Reading Research: Readability. (New York, NY: Longman, 1984)
Levie W.H. and Lentz R. 1982. Effects of text illustrations: A review of research. Educational Communication and Technology Journal 30 (4): 195-232.
Mayer R.E. 1999. Multimedia aids to problem-solving transfer. International J Educ Res. 31:611-623.
National Center for Educational Statistics. 2002. Adult Literacy in America. Available at http://nces.ed.gov/pubs93/93275.pdf. Accessed 8/26/09.
National Center for Educational Statistics, 2006. A First Look at the Literacy of America’s Adults in the 21st Century. Available at http://nces.ed.gov/NAAL/PDF/2006470.PDF. Accessed 8/26/09.
Nitzke S. and J. Voichick. 1992. Overview of Reading and Literacy Research and Applications in Nutrition Education. J Nutr Educ. 24:261-266.
Severin W., Another look at cue summation. (AV Communication Review) 1967:15;233-245
Schwarz N. and D. Oyserman. 2001. Asking questions about behavior: Cognition, communication, and questionnaire construction. Am J Evaluation vol 22 (No 2):127-160.
Sudman S, Bradburn N.M. Asking Questions. Jossey-Bass Publishers, San Francisco, 1982.
Sylva K, M.S. Townsend, A. Martin, D. Metz. 2007. University of California Cooperative Extension Fruit and Vegetable Checklist. University of California, Davis 2007. (English, 7 items reflecting MyPyramid guidelines, 1-page 2-sided sheet for low-literate clients.) Available at http://townsendlab.ucdavis.edu. Accessed Oct. 31, 2009.
Townsend M.S. 2006. Evaluating Food Stamp Nutrition Education: Process for development and validation of evaluation measures. J Nutr Educ Behav 38(1):18-24.
Townsend M.S. (invited speaker), J. Hersey (invited speaker), J. Dharod, 2007. Evaluation Roadmap: Measuring our programs and efforts. J Nutr Educ Behavior 39(4): S88.
Townsend M.S., K. Sylva, A. Martin, D. Metz and P. Wooten-Swanson. 2005. Assessing Face Validity of Photographs to Enhance Comprehension of the EFNEP Food Behavior Checklist. FNEE Preconference Proceedings, Food and Nutrition Extension Educators Division, Society for Nutrition Education; 16. July 23, 2005.
Townsend M.S., K. Sylva, A. Martin, D. Metz and P. Wooten-Swanson. 2008. Improving readability of an evaluation tool for low-income clients using visual information processing theories. J Nutr Educ Behavior 40:181-186.
U.S. Department of Agriculture (USDA), Expanded Food and Nutrition Education Program (EFNEP). Available under: http://www.csrees.usda.gov/nea/food/efnep/efnep.html. Accessed 6-6-09.
U.S. Department of Agriculture Food and Nutrition Service (FNS). Food Stamp Nutrition Education Guiding Principles. http://www.fns.usda.gov/oane/menu/FSNE/GuidingPrinciples.pdf Accessed 6-14-09.
Willis G.B., P. Royston and D. Bercini. 1991. The use of verbal report methods in the development and testing of survey questionnaires. Appl Cognitive Psychol. 5:251-67.
Willis G.B. 1994. Cognitive Interviewing and Questionnaire Design: A Training Manual (Working Paper Series No. 7). Hyattsville, MD: Centers for Disease Control and Prevention, National Center for Health Statistics
http://ncsu.edu/ffci/publications/2010/v15-n3-2010-winter/index-v15-n3-December-2010.php
Back to table of contents ->https://www.theforumjournal.org/2017/09/03/winter-2010-vol-15-no-3/