The Effects of Demographic Characteristics on Financial Well-Being
Claudia J. Heath
University of Kentucky
Jakub Mikuška
University of Kentucky
Martie L. Gillen
University of Florida
Abstract
Data measuring the Consumer Financial Protection Bureau ’s Financial Well-Being Scale were gathered from a representative sample of Kentuckians during spring 2016. Psychometric properties of the five items were tested using principal component analysis and confirmatory factor analysis. The effects of individual demographic characteristics on the Financial Well-Being Scale were tested using a structural equation model. Five of the Financial Well-Being items loaded strongly on a unidimensional factor that explained 57% of the item variance in the exploratory factor analysis. The confirmatory factor analysis indicated that the model fit the data well (α = .866). Of the seven demographic variables, four were statistically significant predictors of financial well-being: household income and age were positive predictors, while household size and being female were negative predictors. Race, marital status, and education were not statistically significant after controlling for the effects of other variables. Overall, the demographic variables explained 25.4% of the variance of financial well-being.
Keywords: financial well-being, CFPB’s Financial Well-Being Scale, demographics, well-being
The Effects of Demographic Characteristics on Financial Well-Being
The Consumer Financial Protection Bureau’s (CFPB) Financial Well-Being (FWB) abbreviated (five-item) scale questions were included in a statewide, representative survey of Kentuckians during the spring of 2016. The responses to the indicator questions developed by the CFPB were then used to construct a conceptual variable version of the CFPB Financial Well-Being Scale. While the initial CFPB Financial Well-Being Scale is an index, where the point values of individual items are summed to create the resulting scale, in the research reported here, the psychometric properties of the conceptual variable version of the Financial Well-Being Scale are tested. Research has shown that financial well-being and financial wellness are influenced by a number of demographic characteristics (Gordon & Whelan-Berry, 2004; Joo, 1998; Joo & Grable, 2004; Porter & Garman, 1993). The effects of individual demographic characteristics on the conceptual variable measure of CFPB’s Financial Well-Being Scale are tested using a structural equation model (SEM).
Demographic characteristics and financial well-being
Financial well-being is “defined as having financial security and financial freedom of choice, in the present and in the future” (Consumer Financial Protection Bureau, 2015). Researchers identified four central elements of financial well-being “(1) a state of being wherein you have control over day-to-day, month-to-month finances; (2) have the capacity to absorb a financial shock; (3) are on track to meet your financial goals; and (4) have the financial freedom to make the choices that allow you to enjoy life” (Consumer Financial Protection Bureau). Time-frame dimensions are represented in the elements where the first and fourth elements relate to one’s present situation and the second and third elements are more future-oriented (Consumer Financial Protection Bureau).
Financial wellness is defined by Joo (1998) as “a level of financial health. It includes satisfaction with material and non-material aspects of one’s financial situation, perception (or subjective assessment) of financial stability including adequacy of financial resources, and the objective amount of material and non-material financial resources that each individual possesses” (as cited in Joo and Garman, 1998). Research has shown that financial wellness is influenced by a number of demographic characteristics such as age, income, education, race, number of dependents, and marital status (Gordon & Whelan-Berry, 2004; Joo, 1998; Joo & Grable, 2004; Porter & Garman, 1993).
Zurlo (2009) used Health and Retirement Study data to examine financial satisfaction, a subjective measure of financial well-being, among older adults. She found that unmarried older adults experienced less financial satisfaction than married older adults, holding all else constant. She also found that non-whites were less financially satisfied than whites. Those with higher incomes were more financially satisfied than those with lower income levels.
Gerrans and colleagues found that financial satisfaction is more important for women’s personal well-being than men’s (Gerrans, Speelman, & Campitelli, 2013). Other researchers found that women are less financially knowledgeable than men when controlling for demographic and economic characteristics (Theodos, Kalish, McKernan, & Ratcliffe, 2014).
Financial well-being is becoming a timely research topic. This research updates and expands findings regarding financial wellness as a function of individual demographic characteristics while specifically testing the influence of these characteristics using the Consumer Financial Protection Bureau’s (CFPB) Financial Well-Being (FWB) abbreviated (five-item) scale for the state of Kentucky.
Data collection
Data were gathered during the 2016 Kentucky Survey conducted for the PI by the University of Kentucky’s Survey Research Center. A dual-frame methodology was used with approximately 35% of the telephone respondents being interviewed by cell phone. Landline respondents were contacted using a modified, list-assisted Waksberg Random-Digit Dialing method (RDD), giving every household telephone line in Kentucky an equal probability of being contacted. Cell respondents were contacted from a random sample of numbers from the rate centers that serve the counties in Kentucky. The final data were weighted to reflect the estimate of cell phone-only households, landline-only, and mixed households in Kentucky. Calls were made from March 4 to April 30, 2016. Up to 15 attempts were made to each landline number in the sample and up to eight attempts to each cell phone number in the sample. In addition, up to 10 scheduled call-backs were made to those we reached at an inconvenient time, and one refusal conversion was attempted. The response rate was 49.4% with a margin of error for the sample of + 3.8% at the 95% confidence level. The final sample used in the analysis was 684 respondents.
The model
Figure 1 is the graphical model of the effects of demographic characteristics on financial well-being.
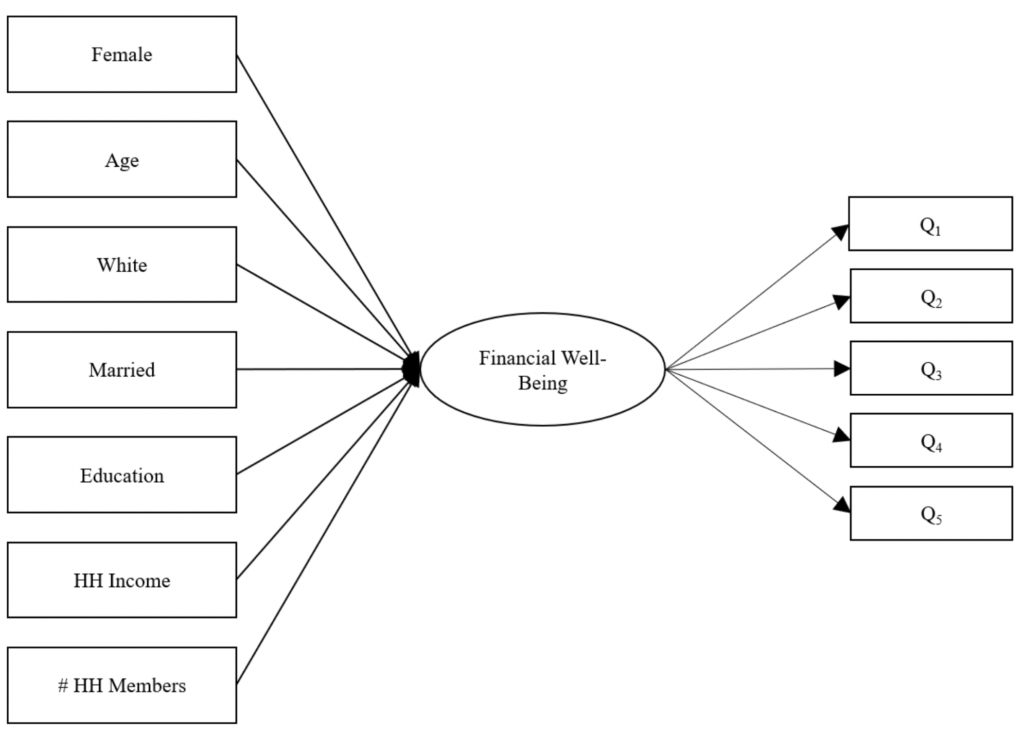
Figure 1: The general structural equation model, errors omitted for clarity
[Alt tag content for Figure 1: The general structural equation model.]
[D link content for Figure 1: Seven rectangles on the left-hand side each respectively labeled with Female, Age, White, Married, Education, HH income, and # HH members have lines leading to an oval in the center labeled Financial Well-Being. That oval then has five arrows pointing right to 5 rectangles labeled Q1, Q2, Q3, Q4, and Q5, respectively.
Variables of interest
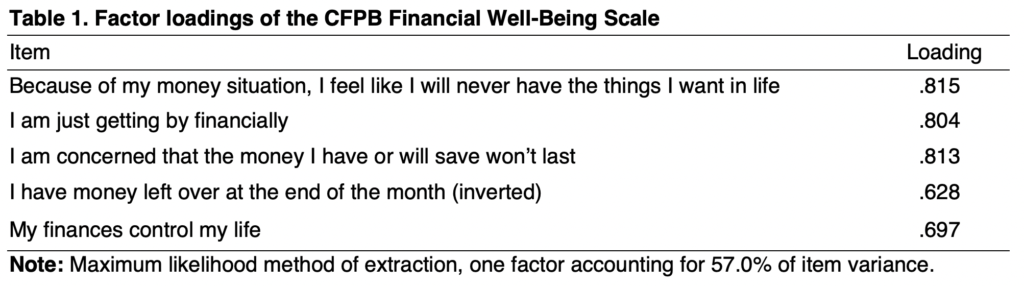
Financial well-being, the primary variable of interest, is a modification of the CFPB Financial Well-Being Scale. Psychometric properties of the five items were tested using principal component analysis (see Table 1) and confirmatory factor analysis. A latent factor of financial well-being indicated by the five items is used in the analytical model rather than an index measure. Seven demographic variables are tested as predictors of financial well-being, namely sex, age, race/ethnicity, marital status, education level, household income, and household size. For more detailed measurement information and sample characteristics see Table 2.
The modified CFPB Financial Well-Being Scale
CFPB Financial Well-Being Scale questions from the abbreviated (five-item) scale were used to test the psychometric properties of the conceptual variable version of the CFPB scale tested for Kentucky. Principal component analysis (PCA) indicated a one-factor solution. The five indicator questions and their PCA loadings can be seen in Table 1, and the response scale can be seen in Table 2. Higher values indicated better well-being.
The internal consistency of the scale was .87 (α = .866). The confirmatory factor analysis of the conceptual variable version of the CFPB scale indicated that the model fit the data well (CFI = .992, RMSEA = .059, χ2(5) = 16.900; AIC = 46.9, BCC = 47.166).
![]()
SEM is used to test the effects of demographic characteristics on a latent factor of the Consumer Financial Protection Bureau’s measure of financial well-being (FWB). Mplus (version 7) was the statistical package used for the analysis. The empirical model (see Figure 2) and results of the analysis are provided below.
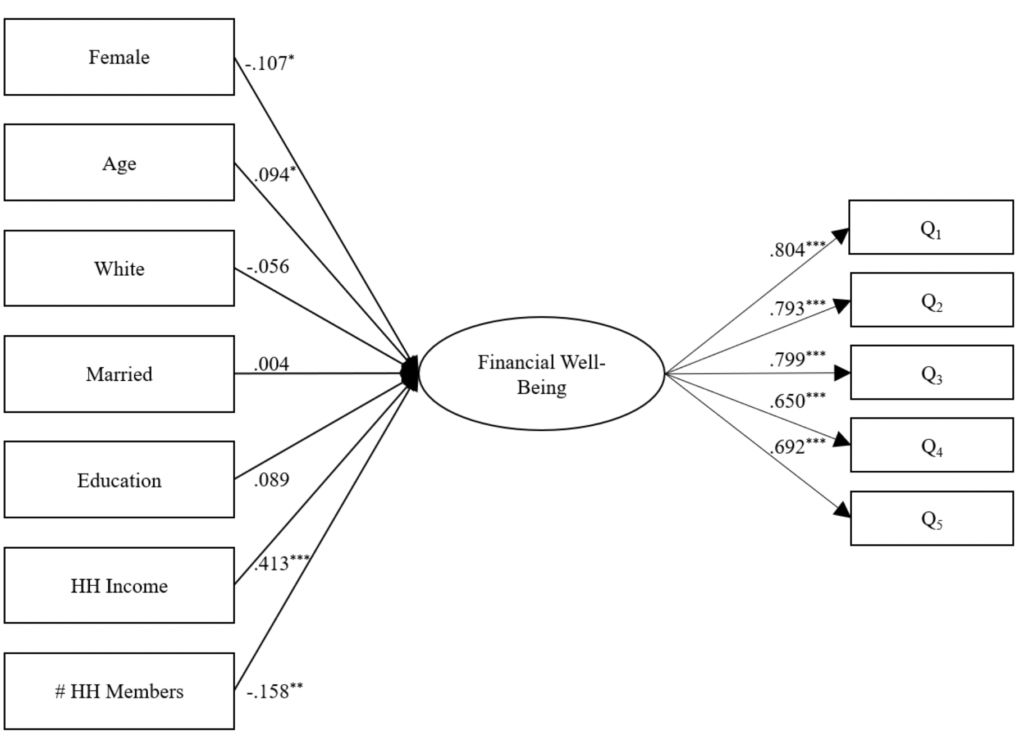
Figure 2: SEM coefficients predicting financial well-being, errors omitted for clarity
[Alt tag content for Figure 2: SEM coefficients predicting financial well-being]
[D link content for Figure 2: The same rectangles and oval from the first figure appear here but with numbers added. From the top, next to the Female-labeled rectangle is the number -.107*, then Age is labeled .094*, White is labeled -.056*, Married is labeled .004, Education is labeled .089, HH income is labeled .413***, and # HH members is labeled -.158**. On the right-hand side, the Q1 box is labeled .804***, Q2 is labeled .793***, Q3 is labeled .799***, Q4 is labeled .650***, and Q5 is labeled .692***.]
Results
All five of the financial well-being (FWB) items loaded strongly (see Table 1) on a unidimensional factor that explained 57% of the item variance in the exploratory factor analysis. The confirmatory factor analysis of the conceptual variable version of the CFPB scale indicated that the model fit the data well (CFI = .992, RMSEA = .059, χ2(5) = 16.900; AIC = 46.9, BCC = 47.166). The internal consistency of the scale was .87 (α = .866).
Out of the seven demographic variables, four were statistically significant predictors of financial well-being, the strongest of which was household income (β = .413, p < .001). Negative predictors of financial well-being included household size (β = -.158, p = .001) and being female (β = -.107, p = .015). Older participants reported higher financial well-being (β = .094, p = .048). Race, marital status, and education level were not statistically significant after controlling for the effects of other variables. Overall, the demographic variables explained 25.4% of variance of financial well-being and fit the data well (CFI = .951, RMSEA = .049, χ2(33) = 86.198; AIC = 25,987.392, BCC = 26,245.486).
Discussion
While the literature provides few measures of financial well-being, some measures of financial satisfaction are available. Comparison of findings from the current study with findings in the literature provides relevance for establishing the role of the CFPB’s Financial Well-Being Scale. In the study by Zurlo (2009), the sample included persons 51 years of age and older. Zurlo’s findings indicated positive significant effects in the categories of married, education, white, and income; while effects of age and sex were not statistically significantly related to financial satisfaction. Joo and Gable (2004), exploring an SEM-based framework for testing determinates of financial satisfaction, identified the effects of demographic characteristics. Age, marital status, race/ethnicity, and sex had no effect on financial satisfaction. Education at less than the college level had a negative direct effect, while college-level-or-above education and income had a positive indirect effect, and the number of dependents had a negative indirect effect. When Porter and Garman (1993) used regression to test a model of financial well-being, individual variables similar to those included in the current model, including sex, ethnicity, income, age (stage in the life cycle), marital status, and number of children in the household, were not statistical indicators of their measure of financial well-being.
Results regarding whether and to what extent demographic characteristics affect financial well-being and financial satisfaction vary across models, samples, and definitions of financial well-being and financial satisfaction. This initial investigation of indicators of financial well-being using the newly conceptualized measure created by the Consumer Financial Protection Bureau contributes to the literature on financial well-being. The Consumer Financial Protection Bureau Financial Well-Being Scale has facilitated a more accurately specified model of the effect of financial well-being on perceived future financial outlook and expected future financial behaviors. “The scale is designed to allow practitioners and researchers to accurately and consistently quantify, and therefore observe, something that is not directly observable — the extent to which someone’s financial situation and the financial capability that they have developed provide them with security and freedom of choice” (Consumer Financial Protection Bureau, 2015). Financial educators and financial practitioners such as counselors and coaches could consider using the scale to enhance their client work and to create more awareness among clients regarding their financial situation and financial capability. Further investigation is warranted by researchers to better understand the relationship among demographic characteristics and financial well-being and financial satisfaction.
Limitations
While this initial investigation of indicators of financial well-being used the newly conceptualized measure created by the Consumer Financial Protection Bureau and contributes to the literature on financial well-being, the data are only representative of Kentucky. Data collection supporting and testing of the CFPB well-being measure in other states is warranted. Likewise, the analysis reported here only tests the effects of demographic variables on financial well-being. Testing the effects of other important variables is necessary to understand more completely what factors affect financial well-being.
References
Consumer Financial Protection Bureau. (2015). Measuring financial well-being: A guide to using the CFPB Financial Well-Being Scale. Retrieved from https://www.consumerfinance.gov/data-research/research-reports/financial-well-being-scale/
Consumer Financial Protection Bureau. (2015). Financial well-being: What it means and how to help. Retrieved from http://files.consumerfinance.gov/f/201501_cfpb_digest_financial-well-being.pdf
Consumer Financial Protection Bureau. (2015). Financial well-being: The goal of financial education. Retrieved from http://files.consumerfinance.gov/f/201501_cfpb_report_financial-well-being.pdf
Gerrans, P., Speelman, C., & Campitelli, G. (2013). The relationship between personal financial wellness and financial wellbeing: a structural equation modelling approach. Perth: Edith Cowan University. Research Online. Retrieved from https://ro.ecu.edu.au/cgi/viewcontent.cgi?referer=https://www.google.com/&httpsredir=1&article=1796&context=ecuworks2013
Gordon, J. R., & Whelan-Berry, K. S. (2004). It takes two to tango: An empirical study of perceived spousal/partner support for working women. Women in Management Review, 19, 260–273.
Joo, S. (1998). Personal financial wellness and worker job productivity (Unpublished doctoral dissertation). Virginia Polytechnic Institute and State University, Blacksburg.
Joo, S., & Garman, E. T. (1998). Financial wellness may be the missing factor in understanding and reducing worker absenteeism. Personal Finances and Worker Productivity, 2, 172–182.
Joo, S., & Grable, J. E. (2004). An exploratory framework of the determinants of financial satisfaction. Journal of Family and Economic Issues, 25, 25–50.
Porter, N. M., & Garman, E. T. (1993). Testing a conceptual model of financial well-being. Journal of Financial Counseling and Planning, 4, 135–164.
Theodos, B., Kalish, E., McKernan, S., & Ratcliffe, C. (2014). Do financial knowledge, behavior, and well-being differ by gender? Washington, D.C.: Urban Institute. Retrieved from http://www.urban.org/sites/default/files/publication/22456/413077-Do-Financial-Knowledge-Behavior-and-Well-Being-Differ-by-Gender-.PDF
Zurlo, K. A. (2009). Personal attributes and the financial well-being of older adults: The effects of control beliefs. PARC Working Paper Series, WPS 09-03. Retrieved from http://repository.upenn.edu/cgi/viewcontent.cgi?article=1026&context=parc_working_papers